
Inventory planning is a complex task - with increasing complication of multi-channels, greater variability of demand and more erratic lead times, the job of managing inventory, often within constraints, is becoming ever more difficult.
Poor inventory planning is very costly. Among other things, it results in wrong combinations of stocks, excessive stock levels, over-investment, poor utilisation of capital and lost revenues. Other consequences include out-of-stock issues and too much time spent on the buying process.
This paper raises a few issues that organizations can apply to their business to gain better control of their inventory planning process. This will lead to higher profitability by delivering improved service levels whilst lowering inventory and providing way of achieving more cost- effective operations.
We will discuss how correct forecasting techniques, calculation of safety stocks and the effective use of early warning systems can improve the overall inventory planning process and improve profits. We will also examine how these issues are not usually solved properly within current business systems and what methodology can be used to improve them.
Reduce complexity but increase accuracy
In order to reduce the inventory complexity for planning, companies tend to go through a journey. The journey starts with basic ‘rule of thumb’ safety stock calculations, adding to expected demand a specific number of days or weeks cover, to ensure given service levels are met to the end customer. Stock levels are mainly controlled using min and max measures.
Due to the unpredictability of certain items, demand and importance of certain products, ‘rule of thumb’ safety stocks and min/max stock control can often still lead to out of stocks.
The next stage in the journey is to look to classify or grade products into areas of importance. These areas might be done using rate of sale, profitability, turnover or other means. Grades are set, often using the ABC classification (Pareto Analysis), and then different days/weeks of safety stock cover are applied to different grades. For example, A items which have highest rate of sale, are given 4 weeks safety stock whilst B items are given 3 weeks.
The question then is asked whether the correct forecasting method is being used. Research has shown that a 10% increase in forecast accuracy can lead to a 10% increase in profits. In the next section, we explore what forecasting methods can be used and how to find the best fit forecast per individual SKU by location.
Best practice process is to move to adopt Inventory Optimization techniques. Here each individual SKU by location is reviewed, the best fit forecast is found and used to plan the expected ongoing demand, taking into account seasonality, slow moving products and trends.
Increasing trend towards internet shopping, for example, is automatically detected and used to create ongoing forecast.
Service levels can be set by SKU by location in order to create individual
SKU safety stock requirements. In this way, out of stocks are prevented and availability maintained at given set level but at the lowest possible stock level.
Are you using correct forecasting methods?
One of the most common methods that businesses use to forecast future demand for products is to average the sales over the previous few months. This method can work well for items that are in consistent demand but it does not work well for others. Consider the following example, where the forecast is calculated by averaging the sales over the last 6 months and compare it to the actual sales figures:
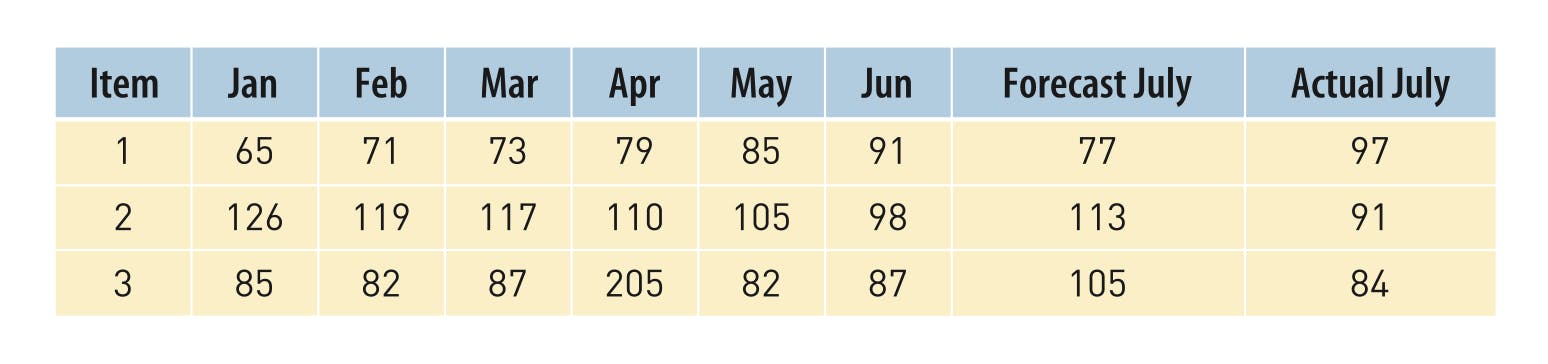
As can be seen from the above example, the forecasting error is very high in all cases and had these forecasts been used for inventory planning purposes they would either have led to excessive stock levels or a stockout situation.
By looking at the figures, we see that item 1 has an increasing sales pattern. Item 2 has a decreasing sales pattern, and item 3 has a seasonal sales pattern where sales increase dramatically in April each year.
Due to the fact that different items can have a very different demand pattern, it is extremely important to choose the most relevant forecasting method for each item. Examples of forecasting modules that can be used based on different types of data are:
- Exponential smoothing - covers a wide range of data characteristics
- Simple methods - for short or volatile data
- Curve fitting - identifies the general form of the curve that the data is following
- Low volume models - for low volume and/or sparse data
- Box-Jenkins - for stable data sets
In ever-changing business environments it is essential to keep an ongoing review of the forecasting process and change the forecasting methods used when the characteristics of each item change.
Effects of unusual activity
Forecast quality is inevitably dependent on the quality of the underlying data. One-off events, such as a dramatic increase in sales or an unusual drop in demand, can dramatically change the forecast for the worse. Consider the demand history for this item:
In this case only 10 units were sold in March because a stockout occurred during that month. The reason for that was the suppliers’ inability to deliver what was needed. This will obviously reduce the quality of future forecasts, as it does not reflect normal demand.
It is important to have a system in place that draws attention to unusual activities, and buyers should carefully examine those transactions and adjust the data used for forecasting purposes in a way that will reflect normal demand.
How do you determine your safety stocks levels?
Safety stock is reserve inventory that is kept for one of the following purposes:
- to avoid stockouts in case of unusual demand
- to cover for the potential inaccuracy of the demand forecast
- to make allowance for failure in suppliers’ services
When determining the safety stock level, it is necessary to look at the order period, ie. the lead time in addition to the time when the next order is made. It is very common for ERP systems to offer ‘rule of thumb’ methods to determine the safety stock level over a range of products. These include, for example:
- a percentage of anticipated demand during the order period
- a specific number of days’ supply
It can be dangerous to apply these simplistic rules over a range of products due to the fact that the predictability of items can vary greatly and so can suppliers lead times.
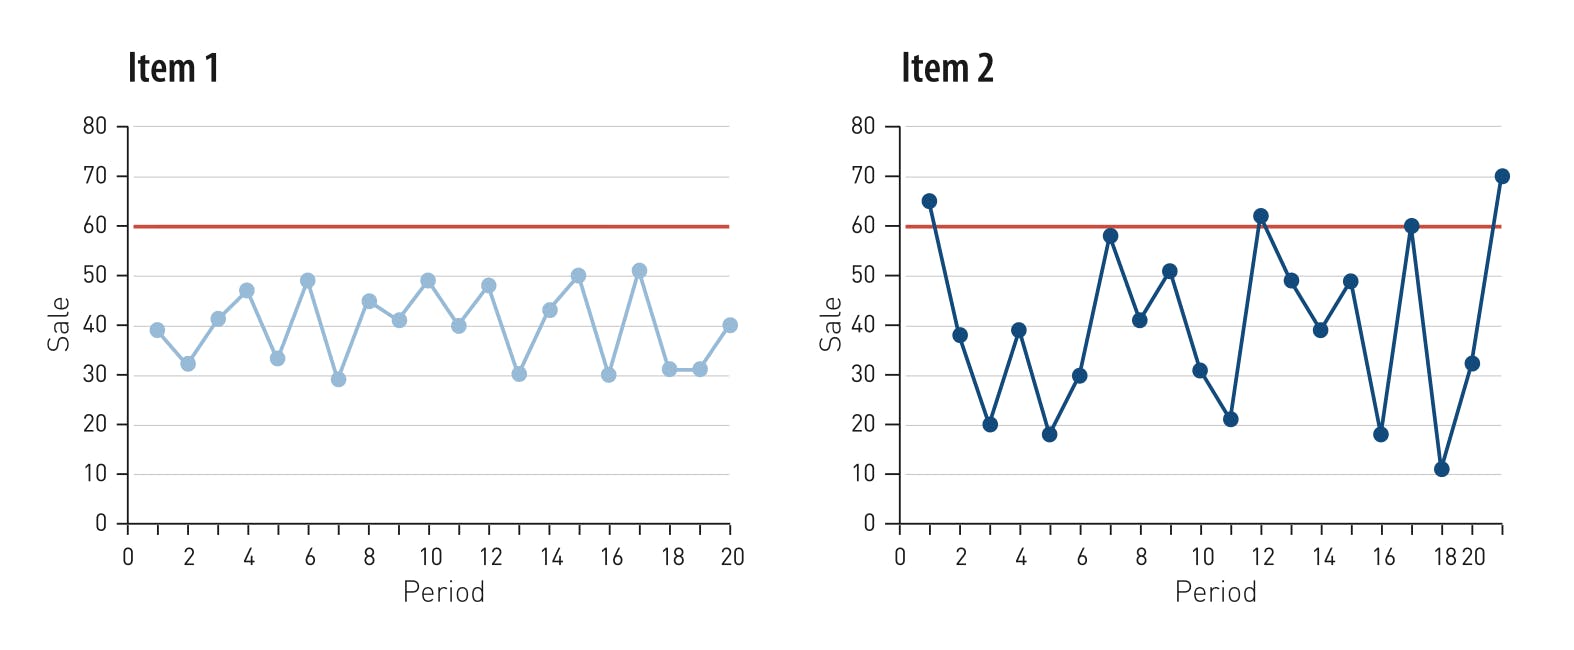
Let’s look at an example of 2 items. Orders are usually made at the beginning of each month and the lead time is one month. On the graph below we see that the average sale of both items is 40 units but the difference in predictability varies significantly between them:
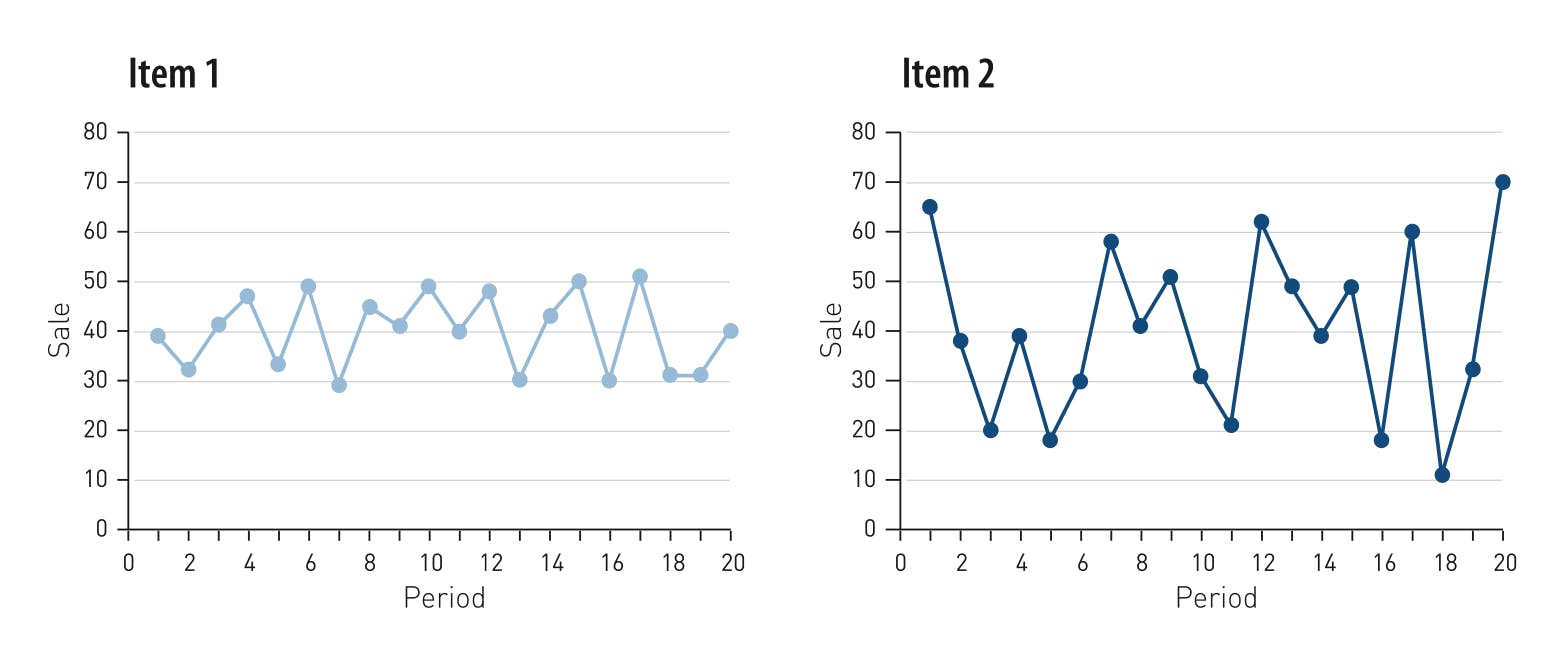
If we applied a ‘rule of thumb’ saying that the safety stock level should be 2 weeks’ average sales, we would order at the beginning of each month the forecast number of 40 units, in addition to the 20 units of safety stock, bringing the total amount to 60 units for both items.
This would mean that we would, on average have too high a stock for item 1 but we would experience repeated stockouts for item 2, as shown in the graphs below:
The above example illustrates that it is very important to calculate safety stocks based on the predictability of each item.
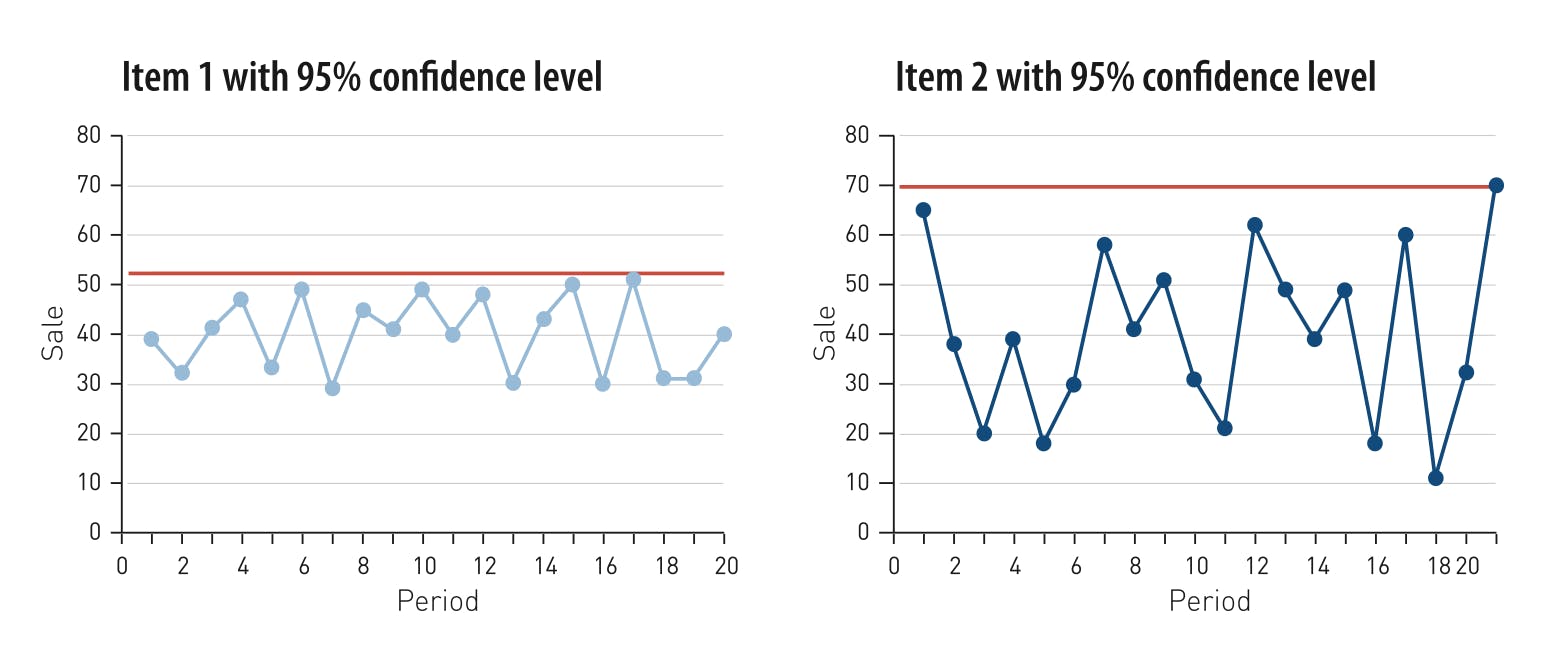
It is a good practice to categorise items according to their importance, ie. A, B or C items according to traditional ABC Pareto Analysis, and determine the optimal service level for each item. The safety stock should then be calculated, based on the predictability and the desired service level. The pictures below show these same two items where the “correct” safety stock has been calculated with a 95% likelihood of not running out of stock (confidence level).
To maintain the same service level for these items we would therefore need to order 50 units for item 1 and 70 units for item 2 at the beginning of each month.
Do you have an early warning system?
Most business systems provide users with reports which show stocked products that have run out of inventory. Business Information (BI) tools provide excellent way of slicing and dicing this information into meaningful reports. These reports pinpoint a problem that already exists, but do not provide an early warning of a potential stockout.
Early warning reports can alert the buyer to a potential problem. Example of useful reports could be:
- a list of items where the number of days until stockout is less than the lead time
- a list that shows all items where the sale during the first week of the month is more than 50% of the month’s forecast
- a list of items where previous days’ sale is more than 50% of this week’s forecast
- a list that draws attention to items with unusual activity
These early warning reports could be restricted to A or B items which are important to your company, so as to prevent buyers from becoming overwhelmed with data. By using these kinds of reports, buyers could use appropriate methods such as expediting orders to prevent problems before they occur. It also enables them to manage-by-exception.