In our effort to constantly develop new technologies for our SCM software and our customers, we have added two new machine learning functions within the AGR Inventory module.
While our AGR software has had machine learning capabilities for years, these two new functionalities will help to give your supply chain that extra boost against your competition.
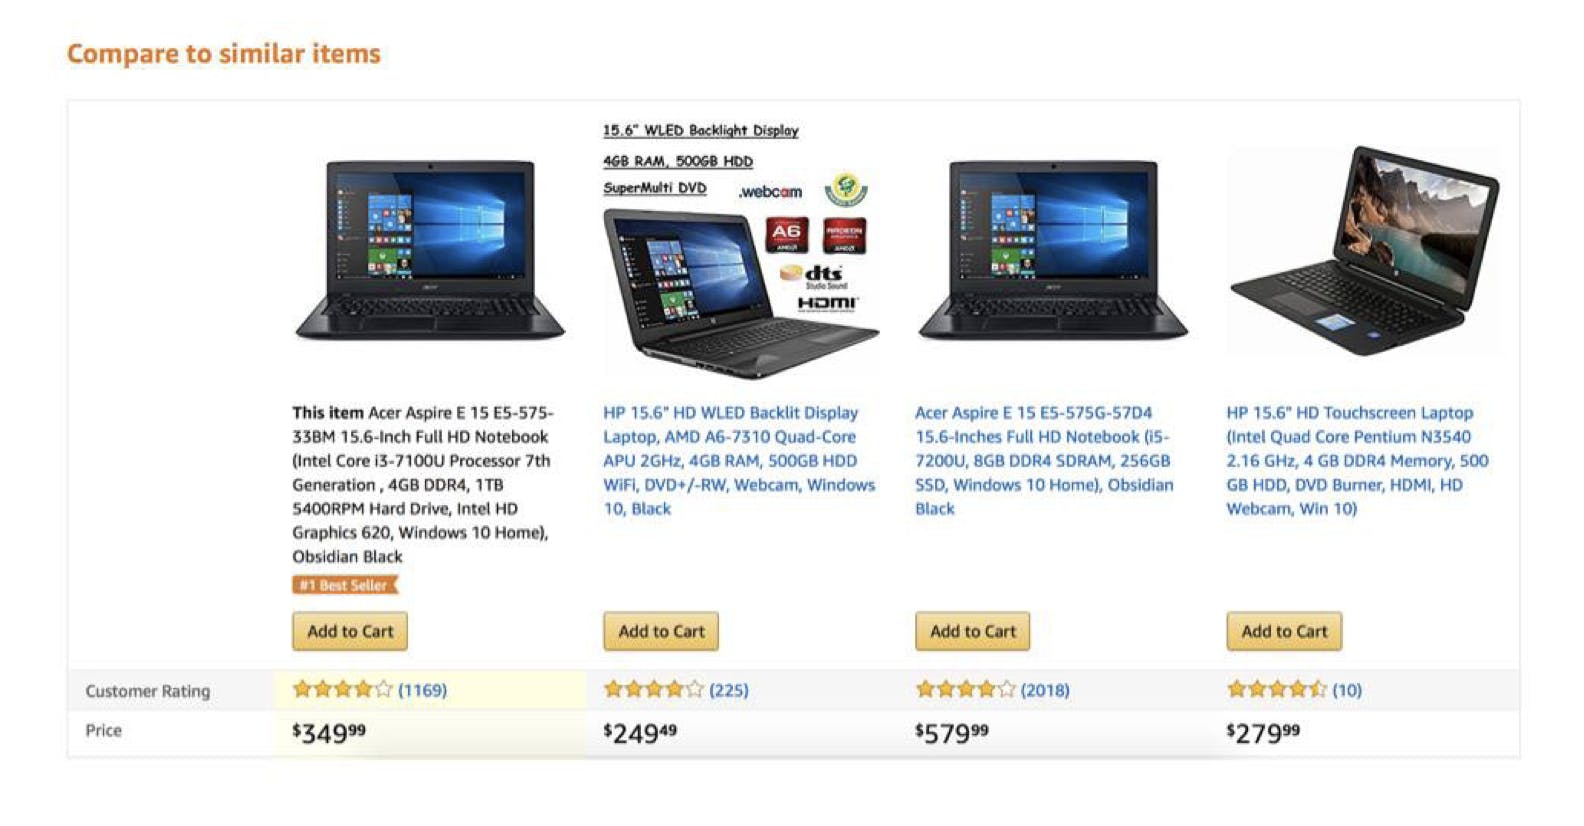
Before we get started, let’s go over the basics. Machine learning is an automatic computer analysis that uses data to find patterns and create forecasts. Machine learning uses data to create a program, the program learns from experience and then decides based on that experience. This is just like humans – we gain knowledge, learn from experience, and then make decisions based on the knowledge and experience we have. One of the most common example of machine learning is the “Compare to similar items” on Amazon, as seen in the image below:
Increased amounts of data and progress in software technologies has resulted in machine learning gaining a lot of popularity recently – but data is essential to being able to use machine learning techniques. Which is exactly what most of our customers have – a lot of data!
We created two models. The first is a model that finds correlation between products – that is, it identifies products that often sell together (like the above example from Amazon). And the second is a model that finds similar products in the customer’s product range.
Adding Correlation to AGR Inventory
The first model, the correlation model, looks over the sale history and identifies positive correlation/halo effect between different products. A typical example of this is hot dogs and hot dog bread. If the sale of hot dogs increases, for example because of a price cut or because of the weather, then the sale of hot dog bread will increase by almost the same percentage. The data we needed for this analysis is simple transactional data which all our customers generally have on hand.
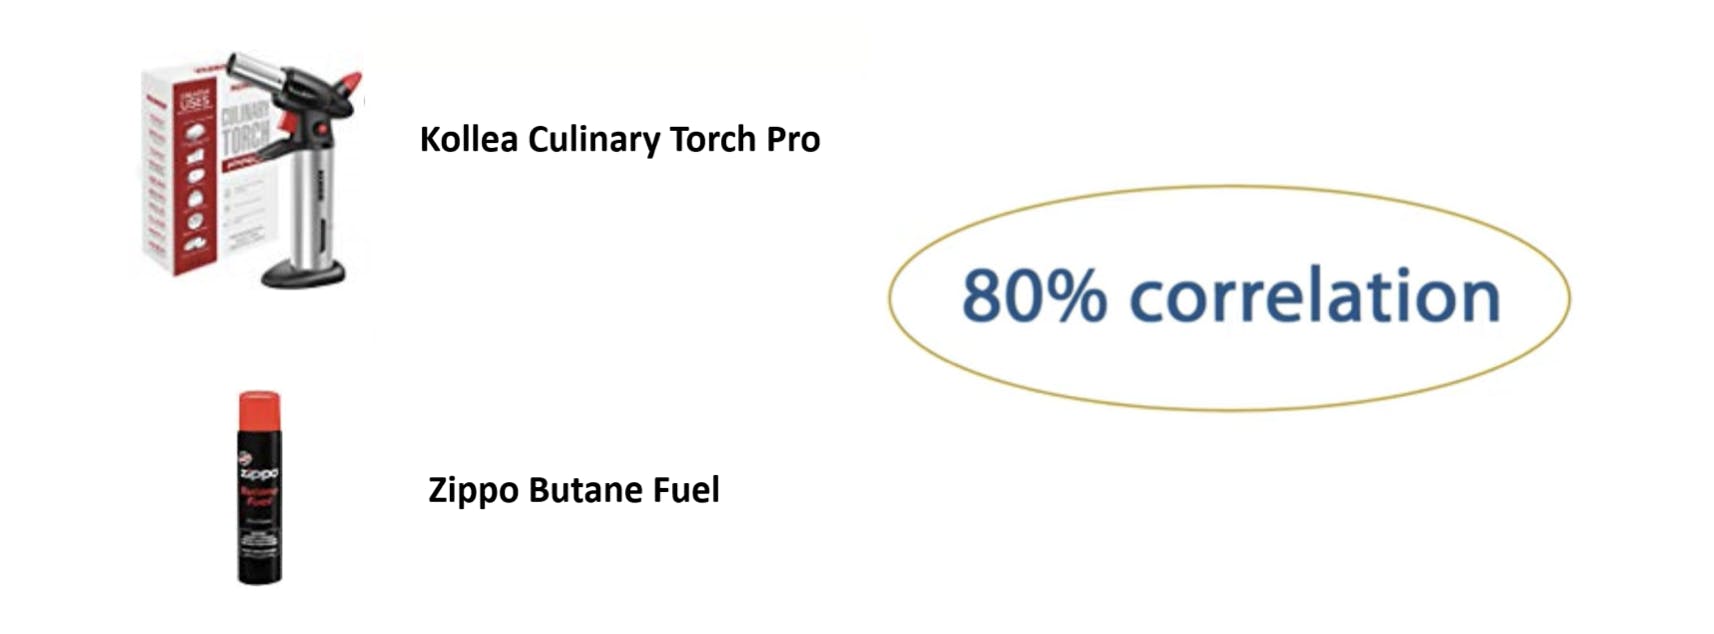
The following examples of identified correlations come from one of our customers. When looking at their data, we found that the following two items, a Culinary Torch and Butane fuel, have a rule of 80% correlation. That means that 80% of the time that a customer purchases a culinary torch, they will also buy a small tank of Butane.
Another example of this type of correlation can be seen between the following FireWire cable and the Apple Adapter with a 50 percent correlation. While this correlation isn’t as strong as the previous example, this means that 50 percent of the time that customers buy a FireWire cable, they also buy an adapter so that the cable fits with Apple computers.

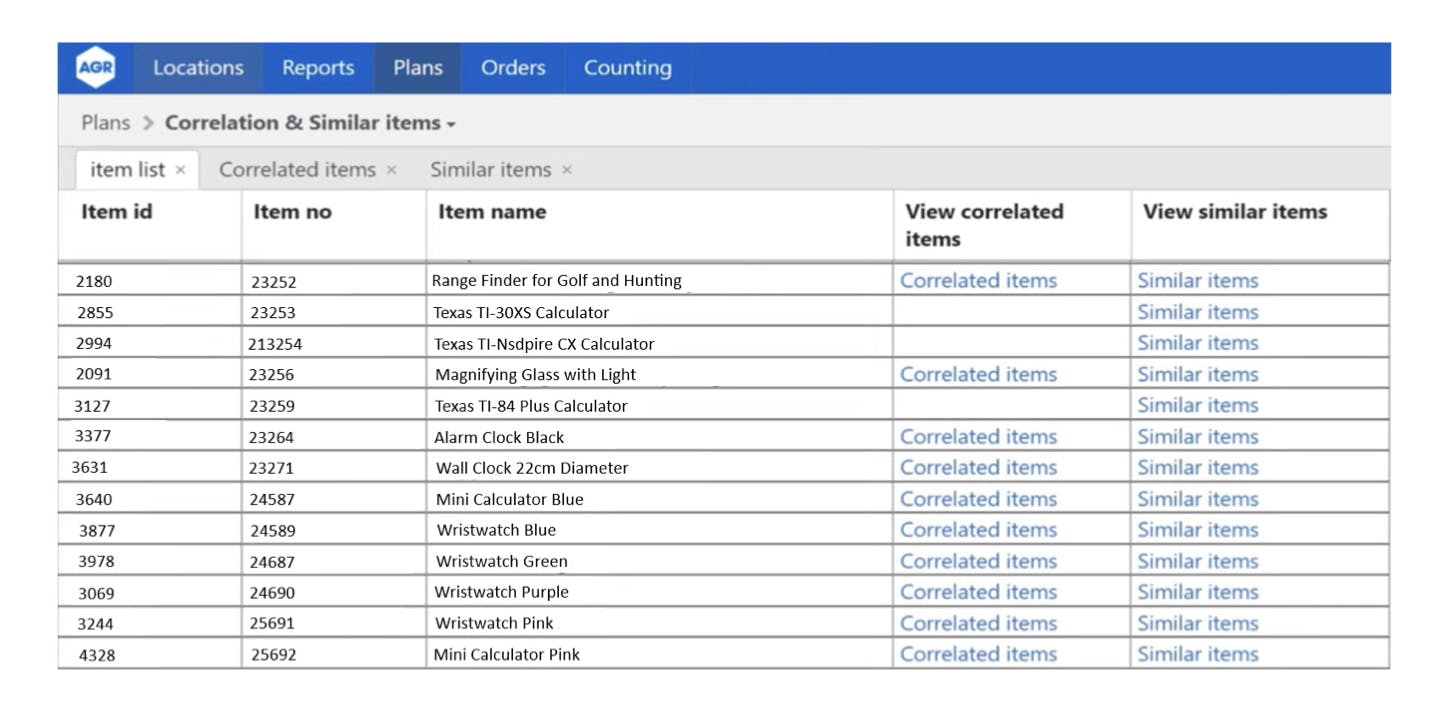
In order to input this technology into our software, we used our powerful planning engine. Within the AGR Inventory module, we used the planner to display the results of the correlation model in a simple and useful manner, as seen below. This view shows a list of your products, with the first two columns containing their numbers and names, and the last two columns show a link to possible correlated items or similar items.
When we click on the ‘correlated items’ link for one of the products, a new view opens. The following product is a magnifying glass with a light and its number and name is in the first two columns (red box). In the next two columns we then see the number and name of the products that are correlated to the magnifying glass (green box), and in the last column, we see the correlation percentage. We can therefore see that this magnifying glass has correlation with two products: a 4-pack and a 10-pack of AA batteries, which are exactly the batteries used for the magnifying glass. Approximately 29 percent of customers buy a 4-pack of batteries when they buy the magnifying glass, and 11 percent buy a 10-pack of batteries.
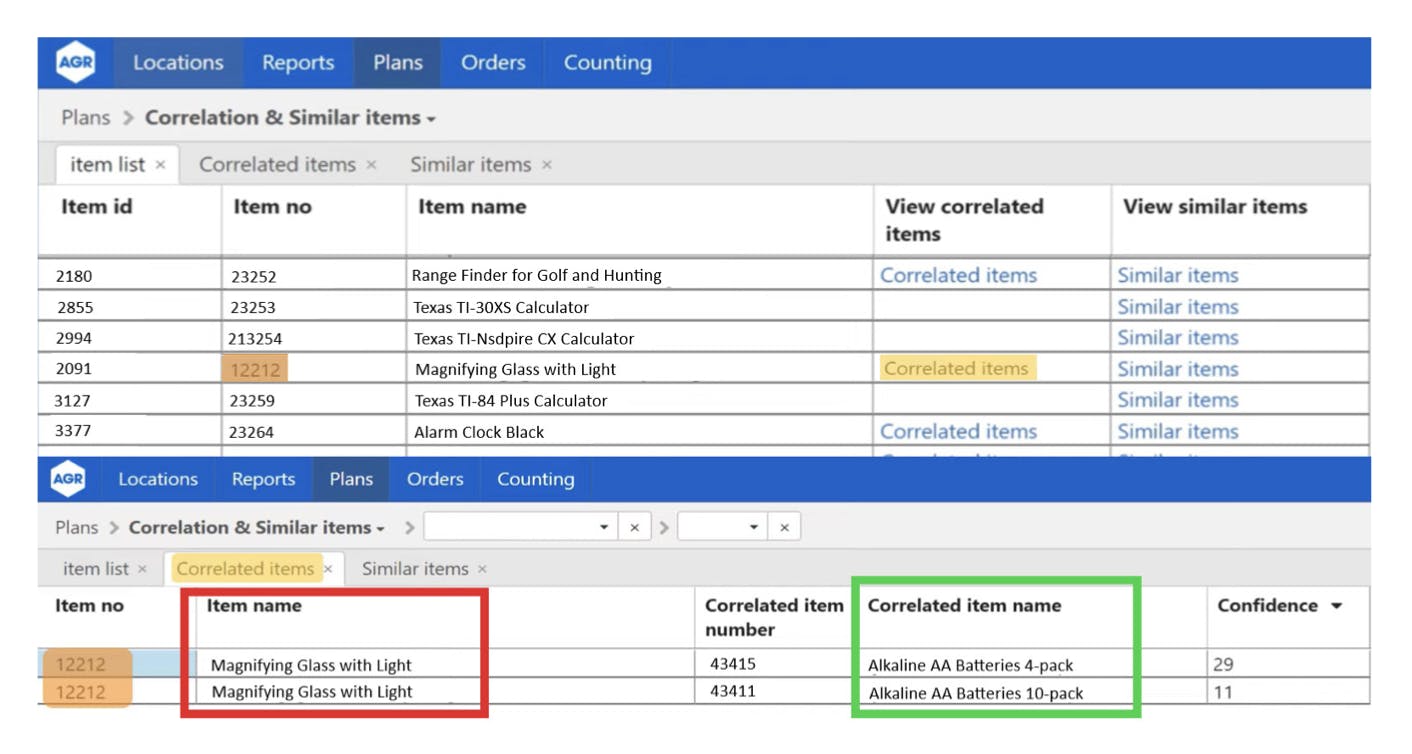
These two views that we see here are very simple and only show correlation between the products, however, we are able to put this functionality into any plans you wish and thereby use this information while planning the sale of products.
More Opportunities Abound
Using this machine learning technology within your AGR setup can open a lot of new opportunities for your business. First, knowing the connection between items can be incredibly useful when planning promotions, since an increased sale of a certain product also affects the products in which
it is correlated. When the user is planning a promotion of, for example, the magnifying glass with the light, they would be able to see the butane fuel tank listed as a correlated item, informing them that the sale of the magnifying glass will also increase the sale of the batteries. While this may seem like common sense, when a company is working with thousands of SKUs, having the software do the work for you will save a lot of time and money for your business. Planning promotions with this information with AGR Inventory can help the user see the true overall effect of the promotion.
This information can also be used for pricing and store layout. If we think again about the culinary torch, 80% correlation is of course a considerably high correlation, however we can assume the fuel does not come with the torch. The customer will need to buy the butane fuel to use the torch, so this would be an opportunity to do make more sales and increase the correlation of these two products closer to 100 percent by examining the products‘ layout in the store, pricing, etc.
Knowing the rates of correlation in online retailing is also incredibly useful, as when the customer adds the magnifying glass to his basket, then we can point out the fact that other customers often buy AA batteries at the same time and thus encourage him to do the same, just like the first Amazon example ‘Frequently bought together.’
Identifying Similar Items with Machine Learning
The next model we created finds similar products in the product range. An example of this, can be seen below with several different types of ketchup:
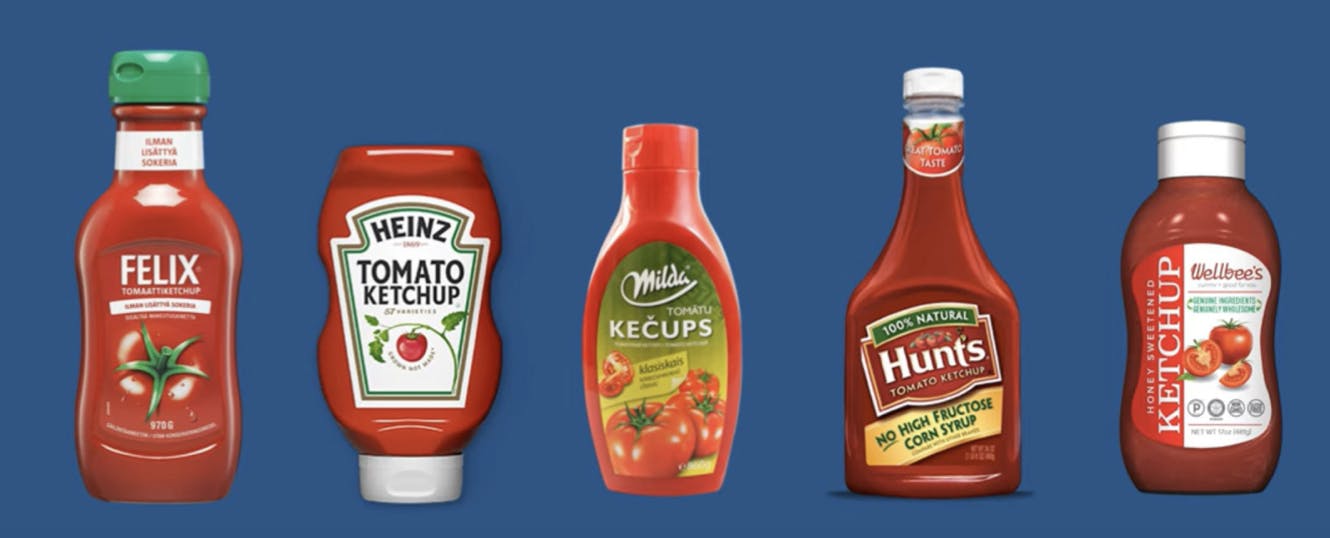
The data needed to find these similarities is already in the AGR system, for example product name, description, price, color, product group, etc. As product features can differentiate between companies and how they define or describe their products, we can also use different information if necessary. In general, the more information we have on the products, the better the results will be.
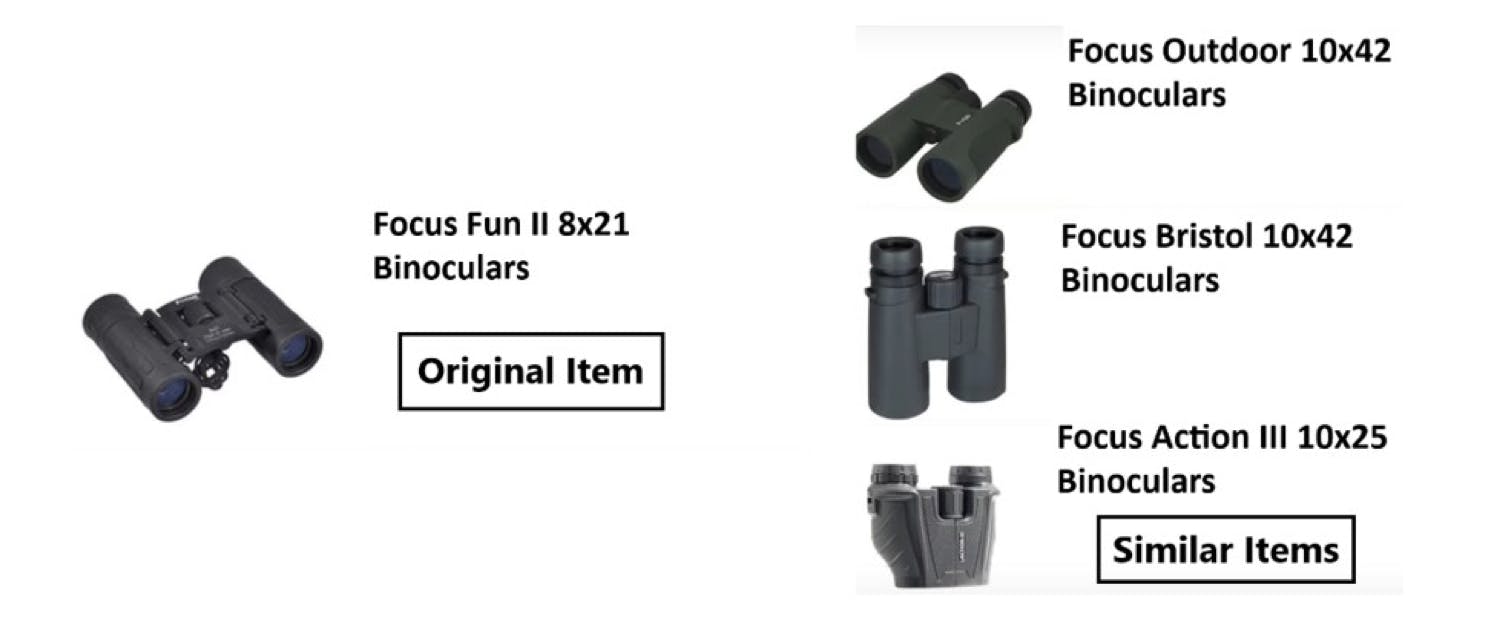
When looking at all the items of a typical retail store, we can also see similar items within their system. For a certain product, in this case black Focus binoculars, the system displays the three products it calculates as its most similar products. As we can see, the results are three very similar binoculars.
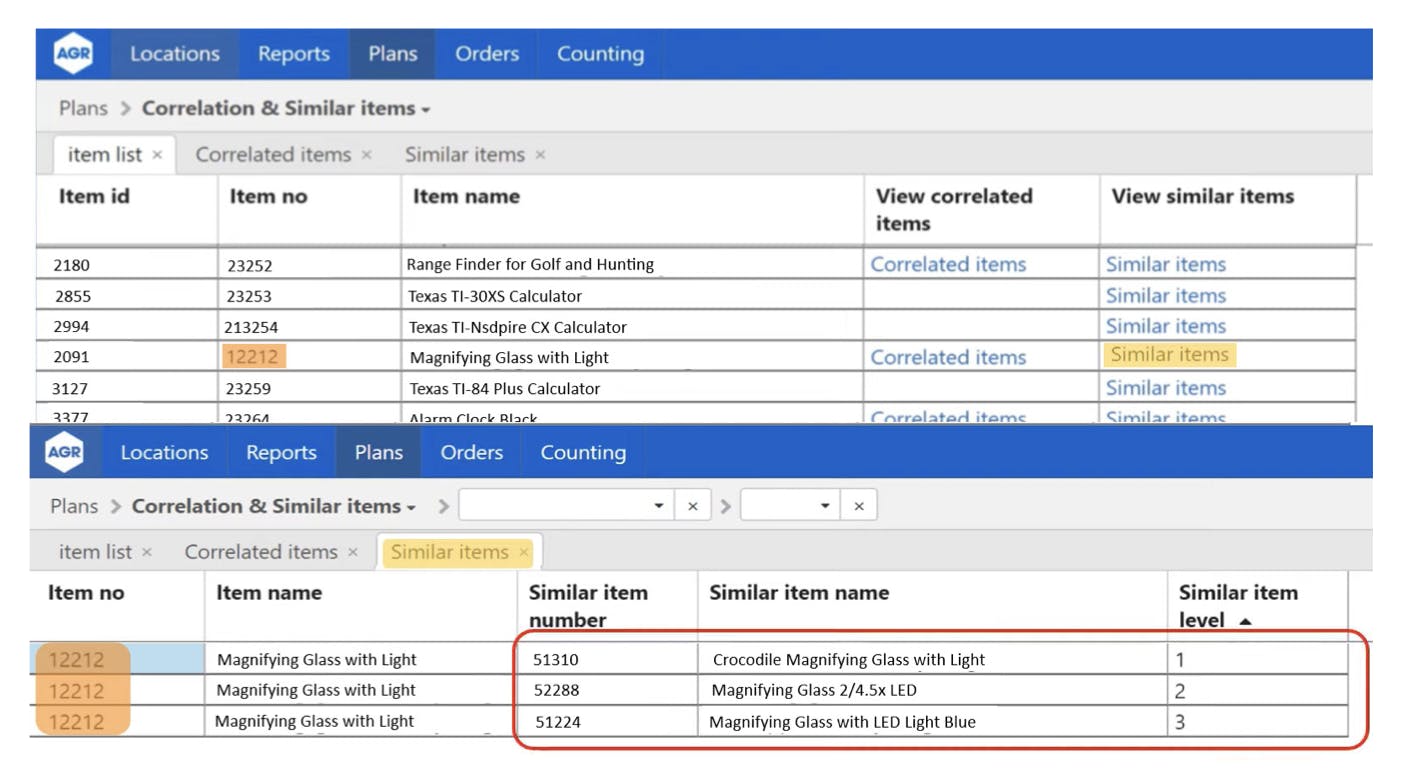
Looking again at our planner, we have created a ‘Similar Items’ column next to the ‘Correlated Items’ If we again take the same magnifying glass as an example but now press the ‘Similar Items’ button, a new view will open that displays the three other magnifying glasses with a light, just like our original product.
Adding New Items Is Simple
Using this machine learning technology within the AGR software provides a lot of new functionality for our customers. First, this information can be used to create a sale history for new products. When a new product with no sale history comes into AGR, the system would show the user the three products that are most similar to this new product and the user can choose one of those products and its sale history to create a forecast for this new product.
This model could also be used for planning promotions. Similar products often have negative correlation with each other, e.g. if you have two similar products from two different manufacturers, and you put one on promotion, its sale will increase whereas the sale of the similar product will simultaneously decrease. Knowing this will allow you to see and understand the overall effect of putting a product on promotion within your business operations.
Finally, this information can also be used for handling price changes, because when long term changes are made to the price of a product, it will generally affect the purchase pattern of the product and products similar to it. So, for example, if Hunt‘s ketchup suddenly dropped in price and would be cheaper than Euroshopper or Coop ketchup, it is very likely that the purchase patterns of those products will change permanently.
Embracing New Technology
Machine learning can be used in various ways in sales and inventory planning. We at AGR Dynamics believe that this technology can be incredibly valuable for our customers, and we strive to stay on top of new technology changes and incorporate them into our supply chain management software. These new developments can make work a lot easier for our customers, by both giving them suggestions and informing them the causes of the decisions they are making. These two new functionalities will help give our customers a better overall view of their product and increase their effectiveness in inventory management.


